⚡ active source
Understanding material properties of the subsurface can help us find energy resources (i.e. oil, gas, geothermal), mitigate hazards, monitor CO₂ sequestration sites, understand ground-water flow, map magma chambers and budget water availability.
🔰 Gerjoii
Gerjoii is: forward modeling of ground penetrating radar and electrical resistivity together with a novel 2.5d joint multi-parameter inversion algorithm that recovers electrical permittivity and conductivity of the subsurface from surface acquired radar and resistivity data. Included is a machine learning routine (PyTorch) for finding the weights needed for the inversion.
For a digested code-tour go here, for the code here.
🌊 Wave utils
Code suite for processing waveforms as recorded by receivers in the field. Features include: frequency domain filtering, beamforming analysis, frequency time analysis, multichannel analysis of surface waves, and virtual source gathers by seismic interferometry. Lives inside Gerjoii.
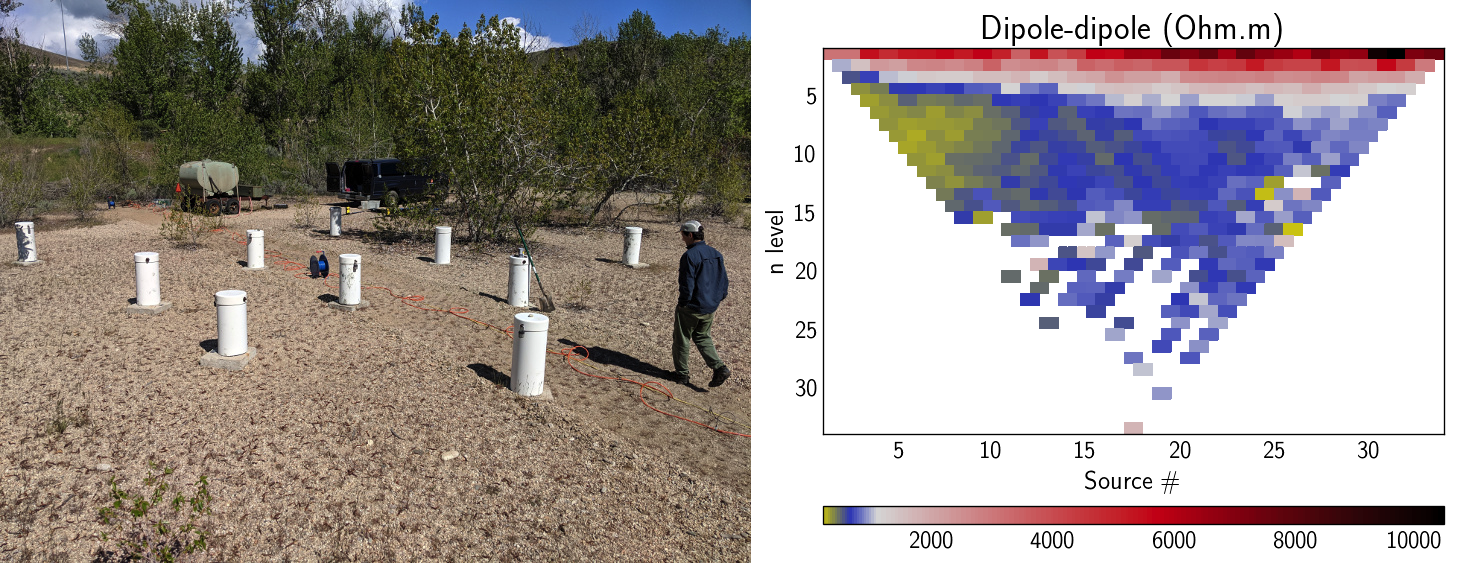
🔌⛽ remediation monitoring
Can we find the 3D spread of the remediation agent in the subsurface using DC data? Yes, it is the blue stuff. Read more about it in the peer-reviewed paper

On the left is the DCIP instrument used in this survey and described here. On the right is the 3D time-lapse result before and after the injection of the remediation agent. Below is a 3D animation of the image on the right showing the plumme of the injected material. The colored dots denote the location of the injections.

Click here for another example of the same experiment at a later time: “was the first result a fluke?” no it was not.
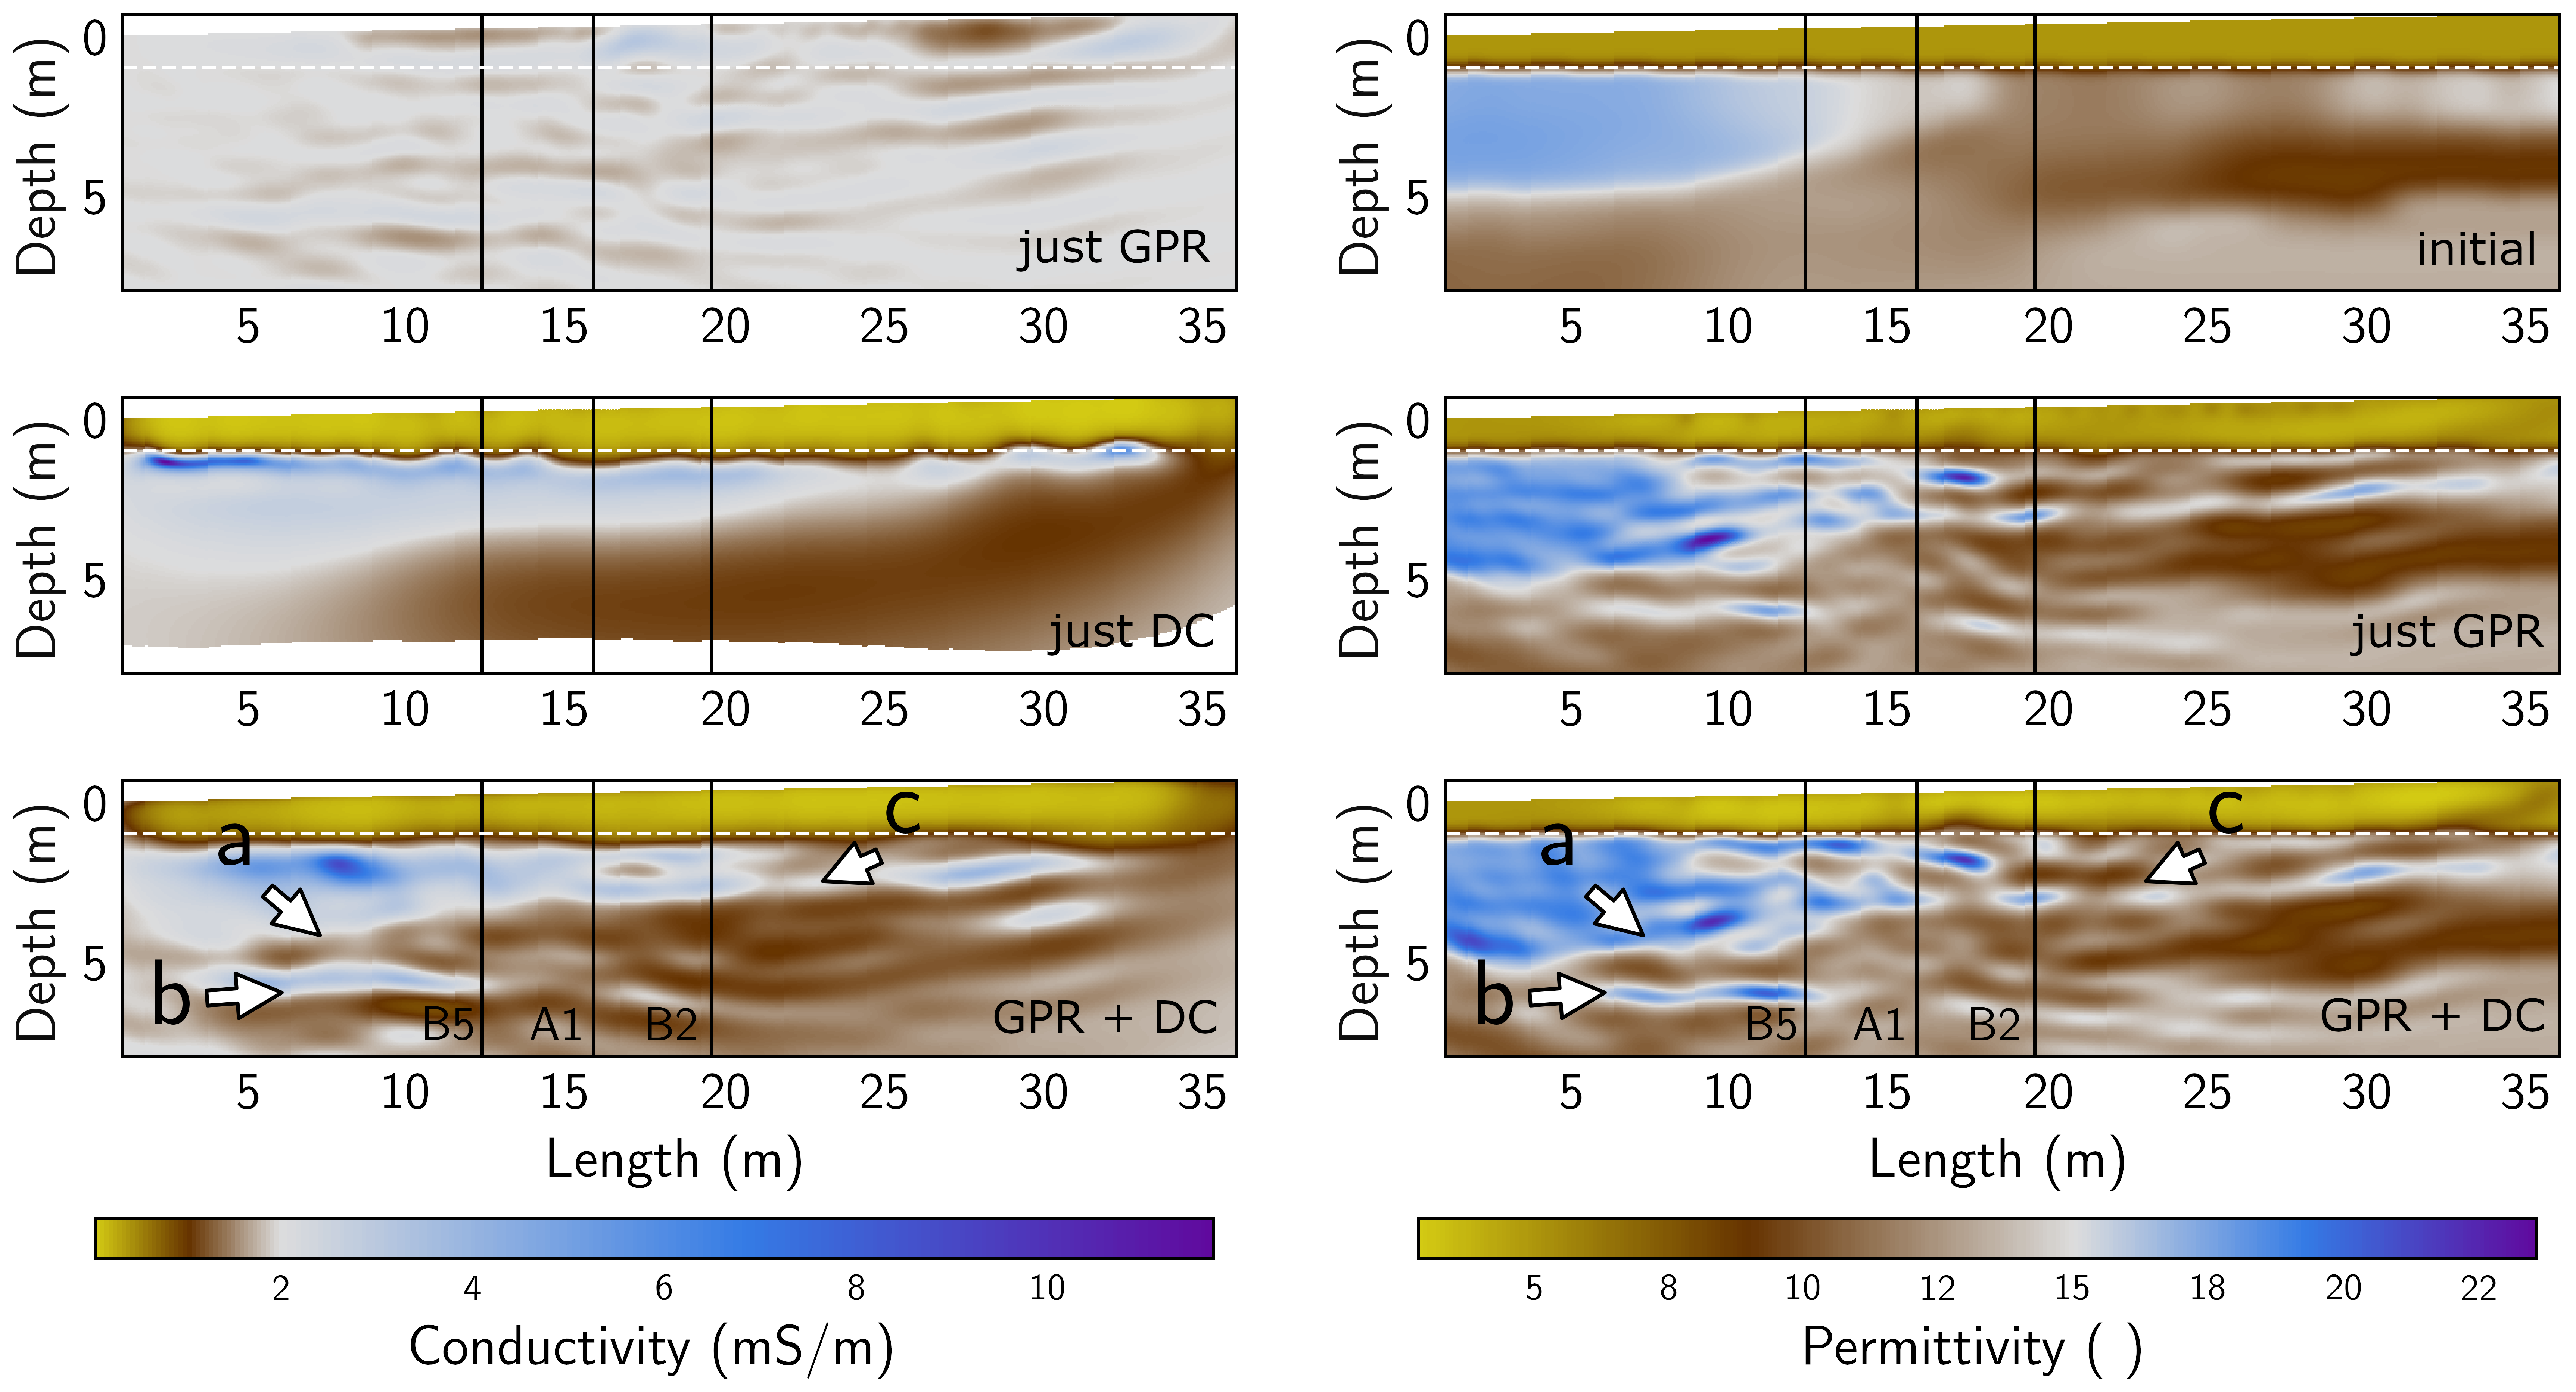
📡🔌 2d multiphysics: GPR full-waveform inversion & DC data
Visit the peer-reviewed paper for details!
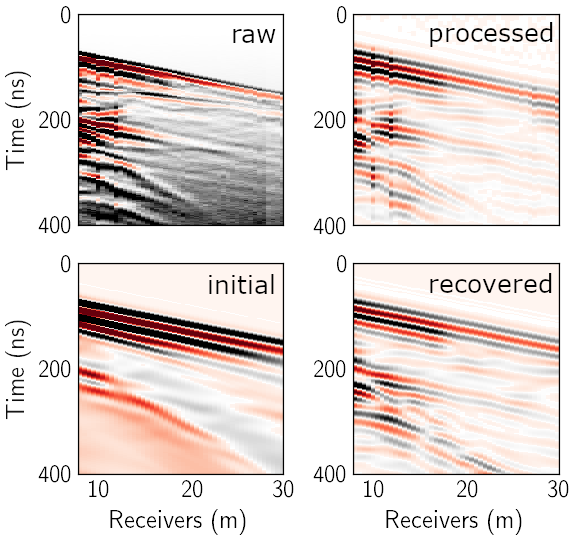
📡 GPR 2d full-waveform inversion
This is a synthetic example of what GPR full-waveform inversion can do. For a field study visit the peer-reviewed paper.

🔌 ER 2.5d inversion
Visit the peer-reviewed paper
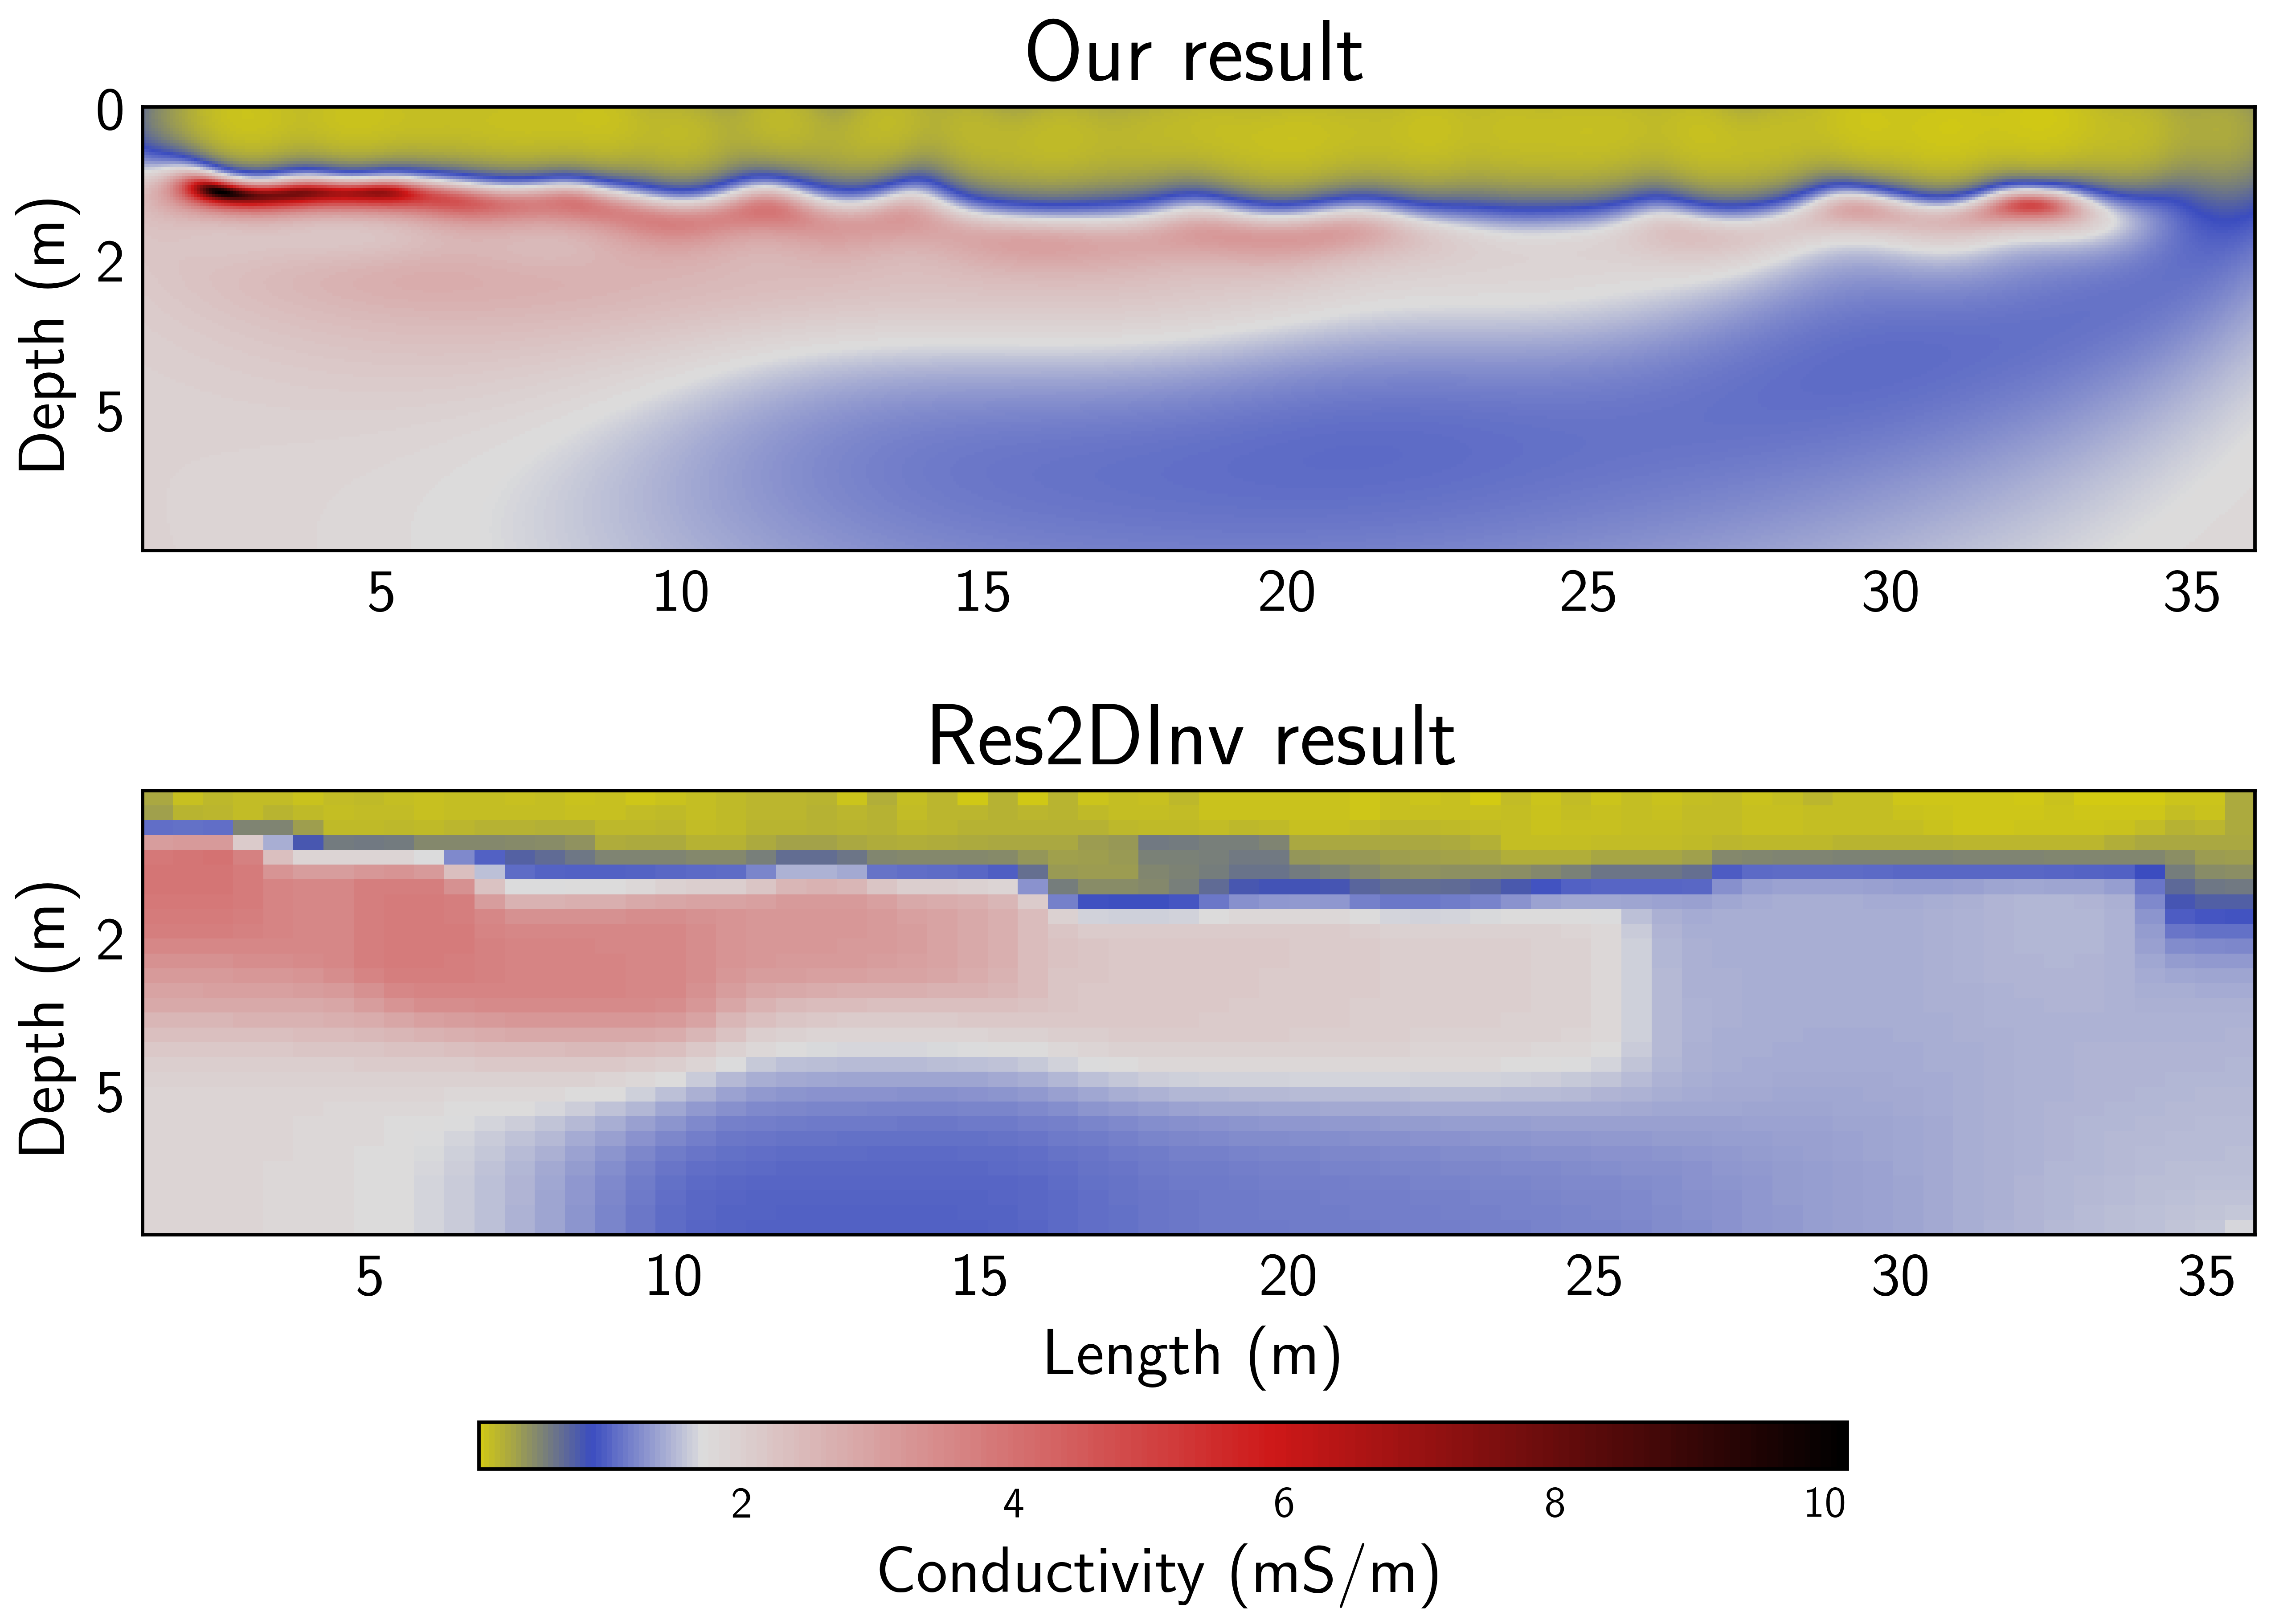
Gerjoii supports 2.5d inversion of ER data. Below is an example of an imaged alluvial aquifer.
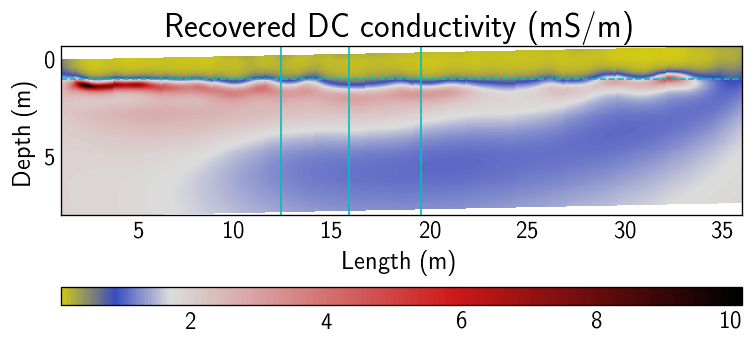
Red is where the ground-water is. Yellow is where dry sand lies. Dashed line is a 1m depth marker. Solid lines are borehole locations.
😉 This method is way better than Res2dInv.
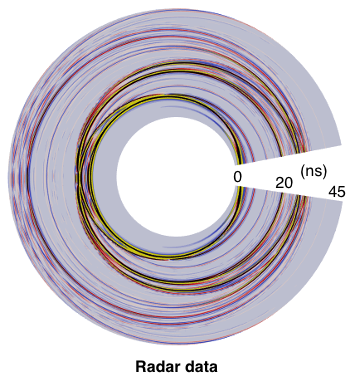
📡🌳 radar on trees
Forward modeling of radar on trees. Left is the wavefield in the tree and right is the observed data.
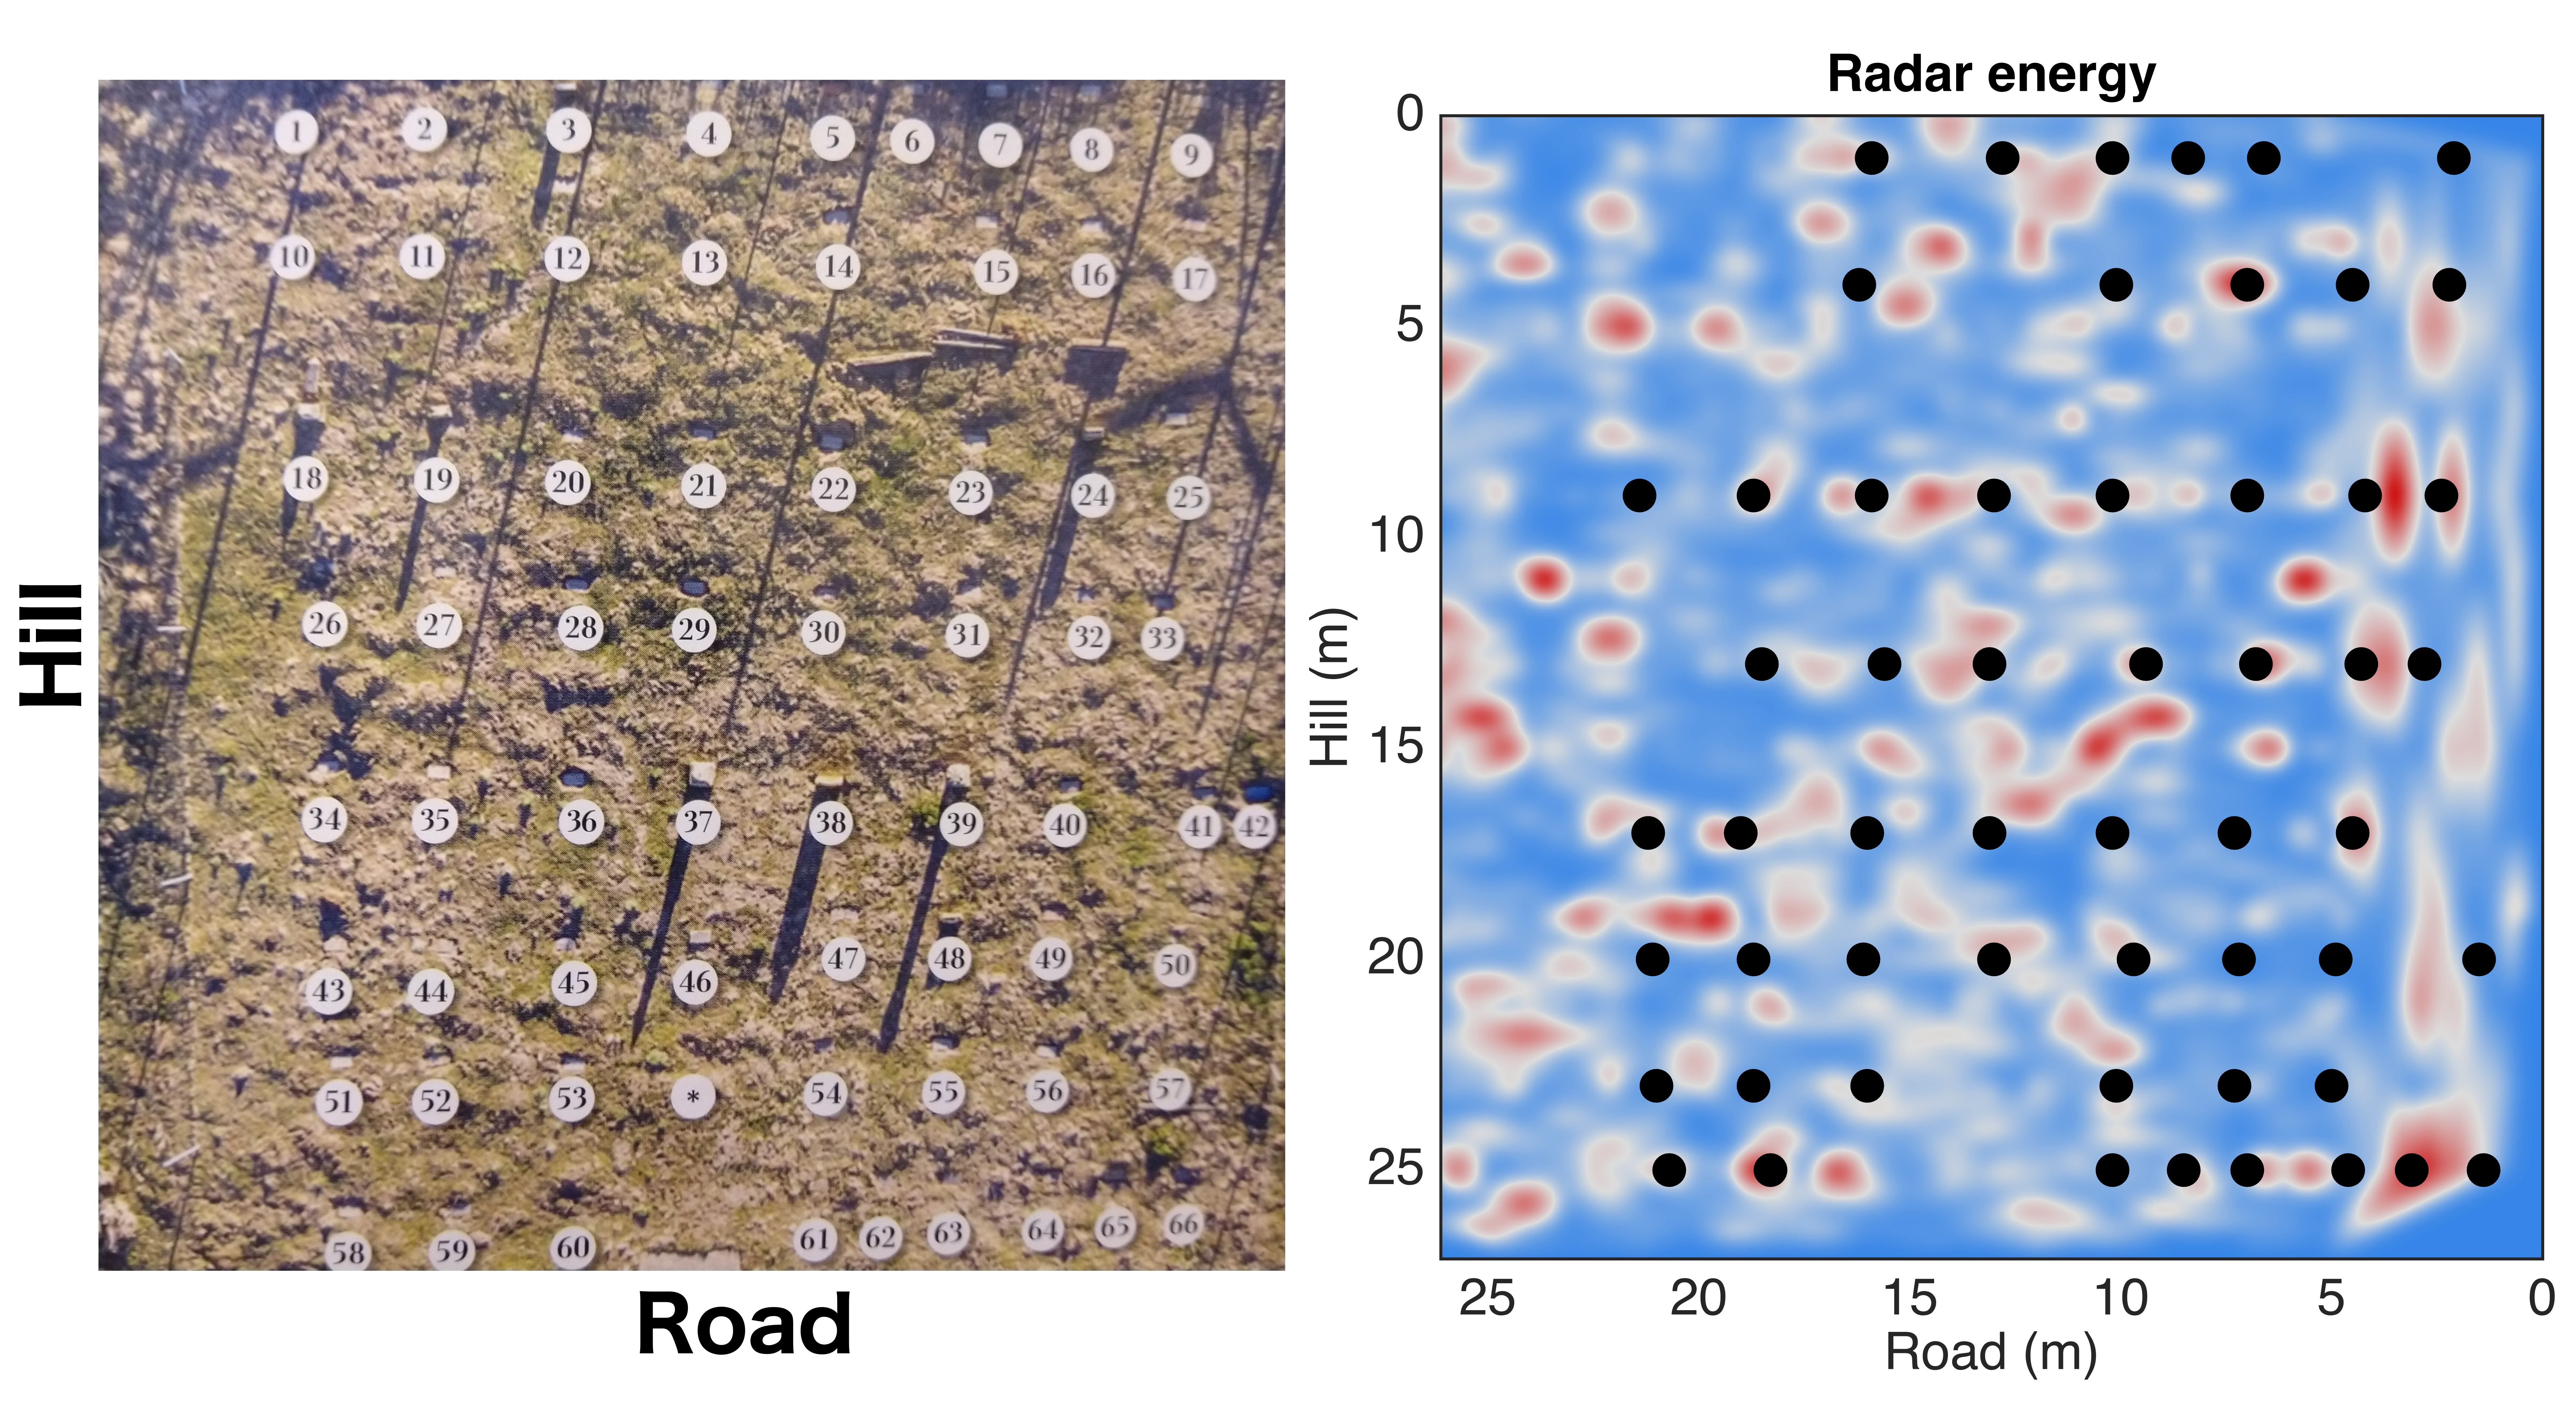
👻 finding graves
Every black dot represents a known grave marker from the image on the left.